10.11 The arc command
Partial arcs of circles may be drawn using the arc command. This has similar syntax to the circle command, but takes two additional angles, measured clockwise from the upward vertical direction, which specify the extent of the arc to be drawn. The arc is drawn clockwise from start to end, and hence the following two instructions draw two complementary arcs which together form a complete circle:
set multiplot
arc at 0,0 radius 5 from -90 to   0 with lw 3 col red
arc at 0,0 radius 5 from   0 to -90 with lw 3 col green
If a fillcolor is specified, then a pie-wedge is drawn:
arc at 0,0 radius 5 from 0 to 30 with lw 3 fillcolor red
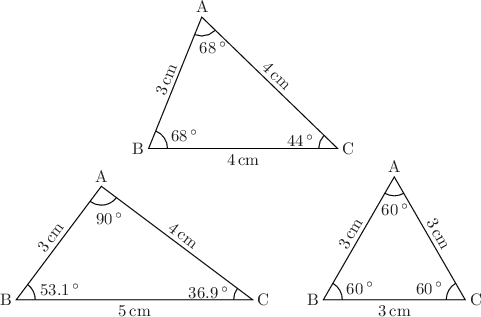
Example: Labelled diagrams of triangles
In this example, we make a subroutine to draw labelled diagrams of the interior angles of triangles, taking as its inputs the lengths of the three sides of the triangle to be drawn and the position of its lower-left corner. The subroutine calculates the positions of the three vertices of the triangle and then labels them. We use Pyxplot’s automatic handling of physical units to generate the latex strings required to label the side lengths in centimetres and the angles in degrees. We use Pyxplot’s arc command to draw angle symbols in the three corners of a triangle.
set unit angle nodimensionless
set unit of length cm # Display lengths in cm
set unit of angle degree # Display angles in degrees
set numeric sigfig 3 display latex # Correct to 3 significant figure
cm = unit(cm) # Shorthand to save space
deg = unit(deg)
turn(a) = matrix( [cos(a),-sin(a)],
[sin(a), cos(a)] )
# Define subroutine for drawing triangles
subroutine triangleDraw(B,AB,AC,BC)
{
# Use cosine rule to find interior angles
ABC = acos((AB**2 + BC**2 - AC**2) / (2*AB*BC))
BCA = acos((BC**2 + AC**2 - AB**2) / (2*BC*AC))
CAB = acos((AC**2 + AB**2 - BC**2) / (2*AC*AB))
# Positions of three corners of triangle
C = B + vector(BC,0*cm)
A = B + turn(ABC)*vector(AB,0*cm)
# Draw triangle
polygon [A,B,C]
# Draw angle symbols
arcRad = 0.4*cm # Radius of angle arcs
arc at B radius arcRad from 90*deg-ABC to 90*deg
arc at C radius arcRad from -90*deg to -90*deg+BCA
arc at A radius arcRad from 90*deg+BCA to 270*deg-ABC
# Label lengths of sides
textGap = 0.1*cm
text "%s"%(BC) at (B+C)/2 gap textGap hal c val t
text "%s"%(AB) at (A+B)/2 gap textGap rot ABC hal c val b
text "%s"%(AC) at (A+C)/2 gap textGap rot -BCA hal c val b
# Label angles
arcRad2 = vector(1.4*arcRad , 0*cm)
text "%s"%CAB at A+turn(-90*deg+ABC-BCA)*arcRad2 hal c val t
text "%s"%ABC at B+turn( ABC/2)*arcRad2 hal l val c
text "%s"%BCA at C+turn(180*deg - BCA/2)*arcRad2 hal r val c
# Label points ABC
text "A" at A gap textGap hal c val b
text "B" at B gap textGap hal r val c
text "C" at C gap textGap hal l val c
}
# Display diagram with three triangles
set multiplot ; set nodisplay
call triangleDraw(vector([2.8,3.2])*cm, 3*cm, 4*cm, 4*cm)
call triangleDraw(vector([0.0,0.0])*cm, 3*cm, 4*cm, 5*cm)
call triangleDraw(vector([6.5,0.0])*cm, 3*cm, 3*cm, 3*cm)
set display ; refresh
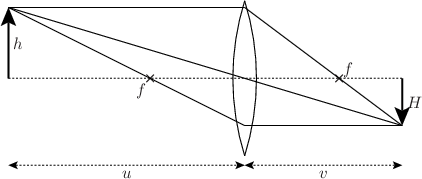
Example: A labelled diagram of a converging lens forming a real image
In this example, we make a subroutine to draw labelled diagrams of converging lenses forming real images.
# Define subroutine for drawing lens diagrams
subroutine lensDraw(x0,y0,u,h,f)
{
# Use the thin-lens equation to find v and H
v = 1/(1/f - 1/u)
H = h * v / u
# Draw lens
lc = 5.5*unit(cm) # Radius of curvature of lens
lt = 0.5*unit(cm) # Thickness of lens
la = acos((lc-lt/2)/lc) # Angular size of lens from center of curvature
lh = lc*sin(la) # Physical height of lens on paper
arc at x0-(lc-lt/2),y0 radius lc from 90*unit(deg)-la to 90*unit(deg)+la
arc at x0+(lc-lt/2),y0 radius lc from 270*unit(deg)-la to 270*unit(deg)+la
set texthalign right ; set textvalign top
point at x0-f,y0 label "$f$"
set texthalign left ; set textvalign bottom
point at x0+f,y0 label "$f$"
# Draw object and image
arrow from x0-u,y0 to x0-u,y0+h with lw 2
arrow from x0+v,y0 to x0+v,y0-H with lw 2
text "$h$" at x0-u,y0+h/2 hal l val c gap unit(mm)
text "$H$" at x0+v,y0-H/2 hal l val c gap unit(mm)
# Draw construction lines
line from x0-u,y0 to x0+v,y0 with lt 2 # Optic axis
line from x0-u,y0+h to x0+v,y0-H # Undeflected ray through origin
line from x0-u,y0+h to x0,y0+h
line from x0,y0+h to x0+v,y0-H
line from x0+v,y0-H to x0,y0-H
line from x0,y0-H to x0-u,y0+h
# Label distances u and v
ylabel = y0-lh-2*unit(mm)
arrow from x0-u,ylabel to x0,ylabel with twoway lt 2
arrow from x0+v,ylabel to x0,ylabel with twoway lt 2
text "$u$" at x0-u/2,ylabel hal c val t gap unit(mm)
text "$v$" at x0+v/2,ylabel hal c val t gap unit(mm)
}
# Display diagram of lens
set unit angle nodimensionless
set multiplot ; set nodisplay
call lensDraw(0*unit(cm),0*unit(cm), 5*unit(cm),1.5*unit(cm),2*unit(cm))
set display ; refresh