Pyxplot |
Examples - Stellar evolution |
Pyxplot is
sponsored and
hosted by

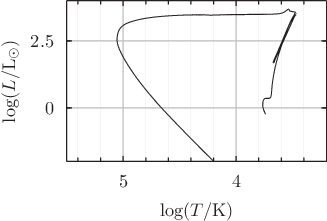
Example plot - the evolution of a star In this example application, the line plot style (abbreviated to l) is used to draw a line through a series of data points representing the evolution of a star in temperature-luminosity space. The using modifier is used to plot the fourth and fifth columns of a datafile. Script
set xlabel r'$\log (T/\mathrm{K})$'
set ylabel r'$\log(L/\mathrm{L_\odot})$'
set nokey
set grid x1y1
plot [5.5:3.2][-2:4] 'stellar_evolution.dat' using 4:5 w l
|
