Pyxplot |
Examples - Branch cuts |
Pyxplot is
sponsored and
hosted by

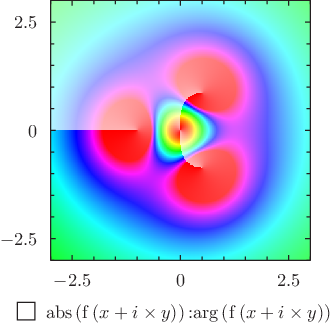
An example of the color map plotting style with custom color mapping A color map of the function 3x^2/(x^3+1), showing the branch cuts between its poles. Script
set numerics complex
set sample grid 400x400
set nogrid
set size square
set key below

set c1range[0:2]
set colmap hsb(c1,c2*0.7+0.3,1)

f(x) = 3*x**2 / (x**3+1)
plot [-3:3][-3:3] abs(f(x+i*y)):arg(f(x+i*y)) with colormap
|