Pyxplot |
Examples - Electromagnetic spectrum |
Pyxplot is
sponsored and
hosted by

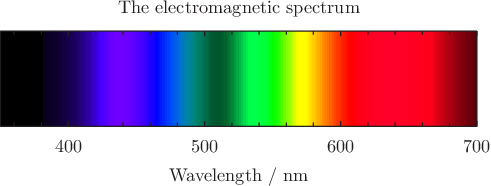
Demonstration of Pyxplot's in-built capability to produce color representations of different wavelengths of light. Pyxplot's built-in functions include a function for generating color objects which match the color of any given wavelength of light, making it very easy to produce diagrams of the electromagnetic spectrum or of white-light diffraction patterns. This example generates a diagram of the electromagnetic spectrum by passing a wavelength to the expression specified in the set colmap command as the variable c1, which equals the first expression specified in the plot ... with colormap command. There is a dark band in the green part of the spectrum, between the regions where the eye's green and blue cones are sensitive, which is often omitted in simpler representations of the electromagnetic spectrum. Script
set nokey
set nocolkey
set size 11 ratio 0.2
set noytics
set xlabel 'Wavelength'
set noylabel
set linear x y
set colmap colors.wavelength(c1,1)
set sample grid 200x2
set c1range norenorm
set title 'The electromagnetic spectrum'
plot [unit(350*nm):unit(700*nm)][0:1] x with colormap
|