Pyxplot |
Examples - Chequer board |
Pyxplot is
sponsored and
hosted by

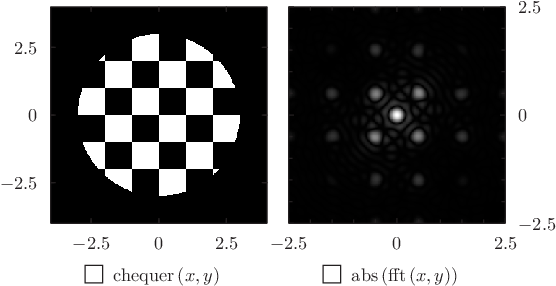
Using the colormap plot style with the fft command to draw a diffraction pattern (III) The Fourier transform of a circular chequer-board pattern, plotted using the colormap plot style. Script
# Definition of function representing a chequer board pattern
chequer(x,y) = (floor(x)+floor(y))%2 * tophat(hypot(x,y),3)

# Take FFT of disk
fft [-40:40:0.1][-40:40:0.1] fft() of chequer()

w = unit(5*cm)
set numerics complex
set nogrid
set key below
set nocolorkey
set sample grid 300x300
set size w square

set multiplot
set nodisplay

# Plot real-space image
plot [-4:4][-4:4] chequer(x,y) with colormap

# Plot Fourier-domain image
set origin w+unit(5*mm),0
set axis y right
plot [-2.5:2.5][-2.5:2.5] abs(fft(x,y)) with colormap

set display
refresh
|