Pyxplot |
Examples - Mandelbrot set |
Pyxplot is
sponsored and
hosted by

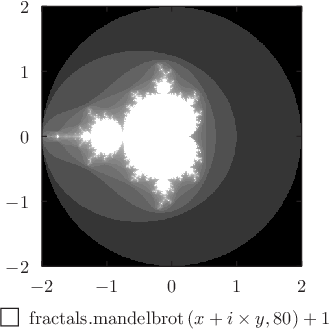
Example plot - using the colormap plot style to draw the Mandelbrot set The Mandelbrot set, plotted using the colormap plot style. Script
set numerics complex
set sample grid 400x400
set log c1
set nogrid
set xtics 1
set ytics 1
set size square
set key below
set nocolkey
plot [-2:2][-2:2] fractals.mandelbrot(x+i*y,80)+1 with colormap
|
