4.6.2 Converting between different temperature scales
Pyxplot can convert temperatures between different temperature scales, for example between  ,
,  and K. However, these conversions have some subtleties which are unique to temperature conversions. This means they should be used with some caution.
Consider the following two questions:
How many Kelvin corresponds to a temperature of
 C?
C? How many Kelvin corresponds to a temperature rise of
C?
The answers to these two questions are 293 K and 20 K respectively: although we are converting from C in both cases, the corresponding number of Kelvin depends whether we are talking about an absolute temperature or a relative temperature. A heat capacity of 1 J/ C equals 1 J/K, even though a temperature of
  C does not equal a temperature of 1 K.
The cause of this problem, and the reason why it rarely affects any physical units other than temperatures is that there exists such a thing as absolute temperature.
Take the example of distances. Distances are almost always relative: they measure distance gaps between points. Occasionally people might choose to express positions as distance from some particular origin. But if scheme A involved measuring in meters from New York, and scheme B involved measuring in feet from Chicago, they wouldn’t expect Pyxplot to convert between the two systems.
The problem of converting between temperature systems is just like this. One system measures distance in degrees Fahrenheit away from 0; another the distance in degrees Celsius away from 0.1
As Pyxplot cannot distinguish between absolute and relative temperatures, it takes a safe approach of performing algebra consistently with any unit of temperature, never performing automatic conversions between different temperature scales. A calculation based on temperatures measured in will produce an answer measured in . However, as converting temperatures between temperature scales is a useful task which is often wanted, this is allowed, when specifically requested, in the specific case of dividing one temperature by another unit of temperature to get a dimensionless number, as in the following example:
|
print 98*unit(oF) / unit(oC) |
![\includegraphics[width=0.9cm]{tick.eps}](images/img-0037.png)
Note that the two units of temperature must be placed in separate unit(...) functions. The following is not allowed:
|
print 98*unit(oF / oC) |
![\includegraphics[width=0.9cm]{cross.eps}](images/img-0036.png)
Note that such a conversion always assumes that the temperatures supplied are absolute temperatures. Pyxplot has no facility for converting relative temperatures between different scales. This must be done manually.
The conversion of derived units of temperature, such as  or
or  , to derived units of other temperature scales, such as
  or
or  , is not permitted, since in general these conversions are ill-defined.
The moral of this story is: pick what unit of temperature you want to work in, convert all of your temperatures to that scale, and then stick to it.
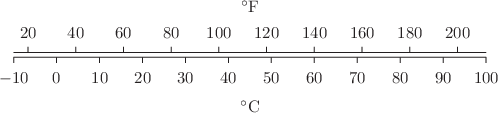
In this example, we use Pyxplot’s automatic conversion of physical units to create a temperature conversion scale.
set size ratio 1e-2
set axis x2 linked x using x*unit(oC)/unit(oF)
set axis y invisible
set xtics outward -10,10
set x2tics outward 20,20
set xlabel r"$

 circ$C"
set x2label r"$
circ$F"plot [-10:100]
Footnotes
- There is one other common example of this problem. Times are expressed as absolute quantities when dates are written down. The year AD 1453 implicitly corresponds to a period of 1453 years after the Christian epoch. So, similar problems arise when trying to convert such a year into the Muslim calendar, which counts from the year AD 622. Pyxplot can, incidentally, make this conversion, using date objects, as will be seen in Section 4.11.