Pyxplot |
Examples - Blackbodies |
Pyxplot is
sponsored and
hosted by

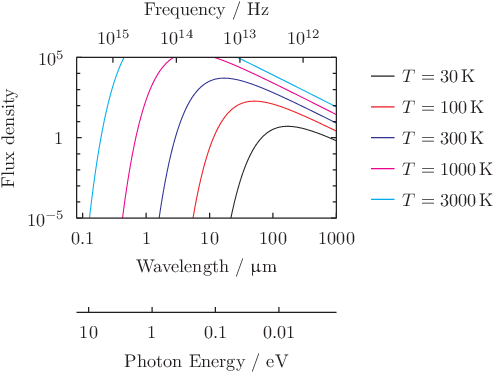
A plot with multiple horizontal axes with linked scales This example uses the set axis ... linked command to create a plot with multiple horizontal axes, whose scales are linked by algebraic expressions. In this application, the scales indicate wavelength of light, frequency of light, and photon energy along an electromagnetic spectrum. Against these axes are plotted blackbody spectra of five different temperatures T, generated using Pyxplot's built-in function for evaluating the Planck formula, Bv(nu,T). The command set unit of ... is used to specified that energies should be measured in electronvolts, and frequencies in hertz. Script
set numeric display latex
set unit angle nodimensionless
set log x y
set key outside
set ylabel "Flux density"
set x1label "Wavelength"
set x2label "Frequency"     ; set unit of frequency Hz
set x3label "Photon Energy" ; set unit of energy eV
set axis x2 top    linked x1 using phy.c/x
set axis x3 bottom linked x2 using phy.h*x
set xrange [80*unit(nm):unit(mm)]
set yrange [1e-5:1e5]
set xtics unit(0.1*um),10
set x2tics 1e12*unit(Hz),10
set x3tics 0.01*unit(eV),10

bb(wlen,T) = phy.Bv(phy.c/wlen,T) / unit(1e-15*W/Hz/m**2/sterad)

plot bb(x,  30) title "$T=  30$\,K", \
     bb(x, 100) title "$T= 100$\,K", \
     bb(x, 300) title "$T= 300$\,K", \
     bb(x,1000) title "$T=1000$\,K", \
     bb(x,3000) title "$T=3000$\,K"

set display
refresh
|
