Pyxplot |
Examples - Sine function zeros |
Pyxplot is
sponsored and
hosted by

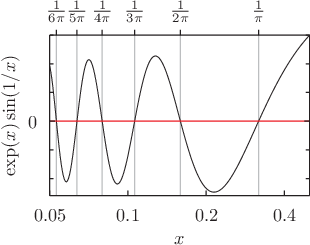
A plot with custom axis ticks This example uses the set axis ... linked command to create two horizontal axes with a common scale. One is displayed along the top of the plot, and the other along the bottom. The top axis is then used to mark significant points in the function plotted, in this case the points where it equals zero. The set x2tics ... command is used to set a list of points to mark with axis ticks, each of which has a numerical position and a string label. Script
set log x1x2
set xrange [0.05:0.5]
set axis x2 top linked x
set xtics 0.05, 2, 0.4
set x2tics border \
     (r"$\frac{1}{\pi}$" 1/pi,      r"$\frac{1}{2\pi}$" 1/(2*pi), \
      r"$\frac{1}{3\pi}$" 1/(3*pi), r"$\frac{1}{4\pi}$" 1/(4*pi), \
      r"$\frac{1}{5\pi}$" 1/(5*pi), r"$\frac{1}{6\pi}$" 1/(6*pi))
set grid x2
set nokey
set xlabel '$x$'
set ylabel r'$\exp(x)\sin(1/x)$'
plot exp(x)*sin(1/x), 0
|