Pyxplot |
Examples - Trajectories |
Pyxplot is
sponsored and
hosted by

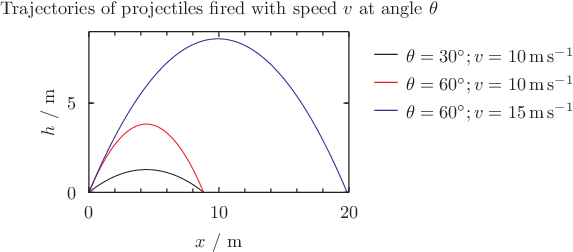
A plot whose axes have physical dimensions of length In this example, the plot's axes have physical units of length, and Pyxplot automatically chooses metres as the most appropriate unit to use when labelling the axes. This behaviour could, however, have been changed using a command such as set unit of length inches. The set key outside command is used to position the plot's key on its right-hand side. Script
# Some numerical constants
g   = phy.g     # Acceleration due to gravity
deg = unit(deg) # Convert degrees to radians

# The mathematical equation of a trajectory
h(x,theta,v) = x*tan(theta*deg) - 0.5*g*x**2/(v**2*cos(theta*deg)**2)

# Plot configuration
set xlabel r"$x$"
set ylabel r"$h$"
set xrange [unit(0*m):unit(20*m)]
set yrange [unit(0*m):]
set key outside
set title r'Trajectories of projectiles fired with speed $v$ at angle $\theta$'

plot h(x,30,unit(10*m/s)) title r"$\theta=30^\circ; v=10\,{\rm m\,s^{-1}}$", \
     h(x,60,unit(10*m/s)) title r"$\theta=60^\circ; v=10\,{\rm m\,s^{-1}}$", \
     h(x,60,unit(15*m/s)) title r"$\theta=60^\circ; v=15\,{\rm m\,s^{-1}}$"
|