Pyxplot |
Examples - Spirograph |
Pyxplot is
sponsored and
hosted by

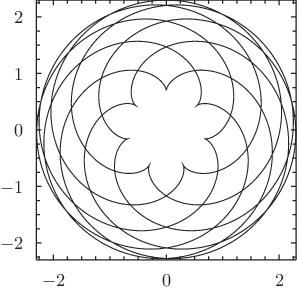
A parametric plot of a spirograph pattern In this example, spirograph patterns are generated as an example of a parametric plot. Rather than plotting some function f(x) against the vertical axis, as a function of x, two expressions are given for x(t) and y(t) as a function of some variable t, which is varied over the range specified in the set trange command. Spirograph patterns are produced when a pen is tethered to the end of a rod which rotates at some angular speed omega_1 about the end of another rod, which is itself rotating at some angular speed omega_2 about a fixed central point. Spirographs are commonly implemented mechanically as wheels within wheels, but in this example we implement them using parametric functions which are simply the sum of two circular motions with angular velocities inversely proportional to their radii. The complexity of the resulting spirograph pattern depends upon how rapidly the rods return to their starting configuration; if the two chosen angular speeds for the rods have a large lowest common multiple, then a highly complicated pattern will result. In this example we pick a ratio of 8:15. Script
set nogrid
set nokey

r1 = 1.5
r2 = 0.8
set size square
set trange[0:40*pi]
set samples 2500
plot parametric r1*sin(t) + r2*sin(t*(r1/r2)) : \
                r1*cos(t) + r2*cos(t*(r1/r2))
|
