Pyxplot |
Examples - Vortex |
Pyxplot is
sponsored and
hosted by

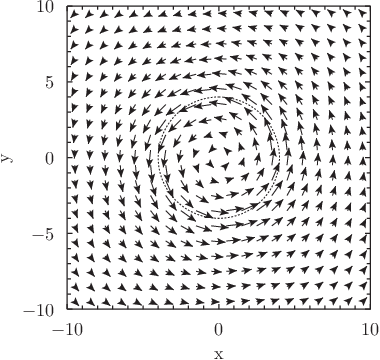
A demonstration of the arrows plotting style: fluid flow around a vortex This example uses the arrows plotting style to a diagram of fluid flow around a vortex. The arrows plotting style takes four columns of input: the (x,y) position of the start of each arrow, and the (x,y) position of the end of each arrow. In this example we assume for simplicity that the fluid in the core of the vortex, at radii r<1, is undergoing solid body rotation with velocity proportional to radius, and that the fluid outside this core is behaving as a free vortex with velocity proportional to 1/r. We plot a dotted line around the core of the vortex using the parametric equation of a circle. Script
set size square
set width 7
set nokey
set xlabel 'x'
set ylabel 'y'
set trange [0:2*pi]
plot 'vortex.dat' u 1:2:($1+$3):($2+$4) w arrows, \
 parametric 4*sin(t):4*cos(t) w lt 2 col black
|