Pyxplot |
Examples - Cornu spiral |
Pyxplot is
sponsored and
hosted by

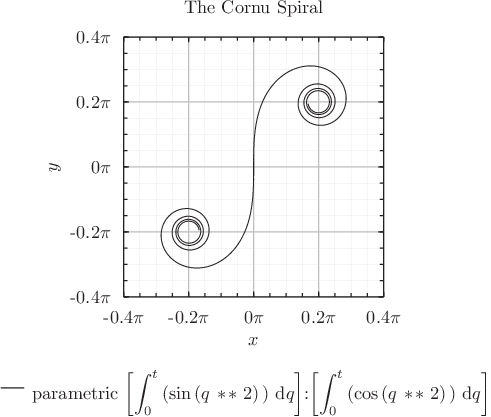
A parametric plot which uses Pyxplot's numerical integration function to draw a Cornu spiral This is an example of a parametric plot. Rather than plotting some function f(x) against the vertical axis, as a function of x, two expressions are given for x(t) and y(t) as a function of some variable t, which is varied over the range specified in the set trange command. In addition we use Pyxplot's built-in functions for numerical integration to evaluate a curve known as the Cornu spiral. A legend is displayed beneath the plot, and Pyxplot automatically generates neat algebraic representation of the expressions plotted, in this case converting evaluations of its numerical integration functions into integral signs. Script
set xlabel "$x$"
set ylabel "$y$"
set xrange [-pi*0.4:pi*0.4]
set yrange [-pi*0.4:pi*0.4]
set xformat r"%s$\pi$"%(x/pi)
set yformat r"%s$\pi$"%(y/pi)
set xtics 0.2*pi ; set mxtics 0.05*pi
set ytics 0.2*pi ; set mytics 0.05*pi
set trange [-5:5]
set samples 1000
set key below
set size square
set grid
set title 'The Cornu Spiral'
plot parametric (int_dq(sin(q**2),0,t)):(int_dq(cos(q**2),0,t))
|