Pyxplot |
Examples - Fibonacci sequence |
Pyxplot is
sponsored and
hosted by

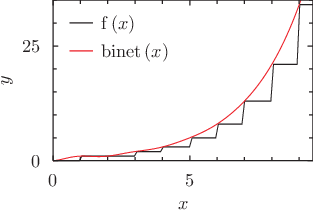
An example of the use of function splicing, to compute Fibonacci numbers The Fibonacci numbers are defined to be the sequence of numbers in which each member is the sum of its two immediate predecessors, and the first three members of the sequence are {0,1,1}. Thus, the sequence runs {0,1,1,2,3,5,8,13,21,34,55,...}. In this example, we use function splicing to calculate the Fibonacci sequence in an iterative and highly inefficient way, hard-coding the first three members of the sequence and then using the knowledge that all of the subsequent members are the sums of their two immediate predecessors. This method is highly inefficient because each evaluation spawns two further evaluations of the function, and so the number of operations required to evaluate f(x) scales as 2^x. It is inadvisable to evaluate it for x>25 unless you're prepared for a long wait. A much more efficient method of calculating the Fibonacci numbers is to use Binet's formula, which provides an analytic expression for the sequence. In the following script, we compare the values returned by these two implementations. We enable complex arithmetic as Binet's formula returns complex numbers for non-integer values of x. Script
f(x)     = 0.0
f(x)[1:] = 1.0
f(x)[3:] = f(x-1) + f(x-2)

# Binet's Formula for the Fibonacci numbers
set numerics complex
binet(x) = Re((goldenRatio**x - (1-goldenRatio)**x) / sqrt(5))

set samples 100
set xrange [0:9.5]
set yrange [0:35]
set xlabel "$x$"
set ylabel "$y$"
set key top left
plot f(x) , binet(x)
|