Pyxplot |
Examples - CMBR temperature |
Pyxplot is
sponsored and
hosted by

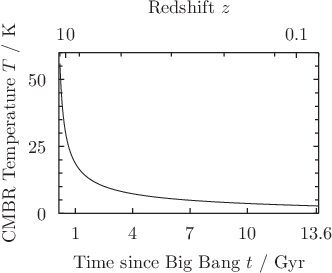
A demonstration of Pyxplot's in-built cosmology functions, and of an axis with a custom non-linear scale This example demonstrates the use of two horizontal axes with linked scales, one of which is displayed along the top of the plot and the other along the bottom. In this case the expression used to link the scales of the two axes, specified using the set axis linked ... command, is one of Pyxplot's specialist cosmology functions, ast.Lcdm_z(), which converts between time since the Big Bang (axis x1) and observed cosmological redshift (axis x2). It does not matter that this conversion is highly non-linear. We use these axes produce a plot of the temperature of the cosmic microwave background radiation (CMBR) as a function of time since the Big Bang, and redshift. Because the temperature of the CMBR is most easily expressed as a function of redshift, we plot this function against axis x2. Script
set nokey

h0 = 70
omega_m = 0.27
omega_l = 0.73
age = ast.Lcdm_age(h0,omega_m,omega_l)
set xrange [0.01*age:0.99*age]
set xtics (unit(1*Gyr),unit(4*Gyr),unit(7*Gyr),unit(10*Gyr),unit(13.6*Gyr))
set unit of time Gyr
set axis x2 linked x using ast.Lcdm_z(age-x,h0,omega_m,omega_l)
set xlabel "Time since Big Bang $t$"
set ylabel "CMBR Temperature $T$"
set x2label "Redshift $z$"
plot unit(2.73*K)*(1+x) ax x2y1
|