Pyxplot |
Examples - Helix |
Pyxplot is
sponsored and
hosted by

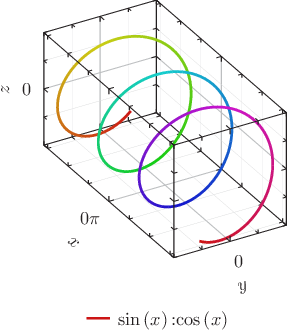
A three-dimensional plot, and a line of variable color When plotting functions in 3D, two functions need to be given -- one for y(x), and a second for z(x). Here, an expression is also given for the color of the line, which varies from point to point. As in expressions passed to the using modifier, the columns of data are referred to as $1 for the first column, i.e. x; $2 for the second column, y; etc. The expression given here uses the built-in function hsb() to produce a color object with the specified hue, saturation and brightness. Script
set xlabel "$x$"
set ylabel "$y$"
set zlabel "$z$"
set xformat r"%s$\pi$"%(x/pi)
set key below
set size 6 ratio 0.5 zratio 0.5
set grid
plot 3d [-10:10][-1:1][-1:1] sin(x):cos(x) with lw 3 \
            color hsb($1/20+0.5,0.9,0.8)
|
