Pyxplot |
Examples - Cornu spiral 3D |
Pyxplot is
sponsored and
hosted by

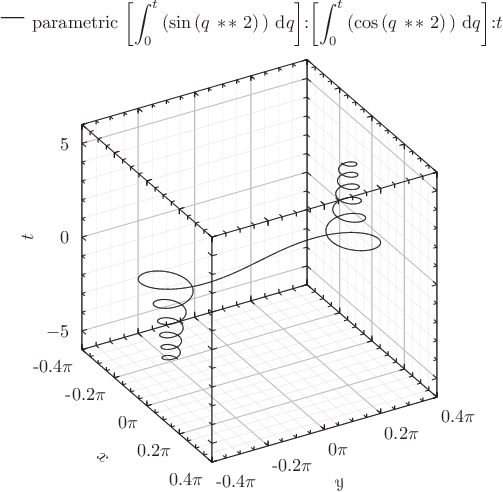
Example plot - a 3D view of the Cornu spiral This example uses Pyxplot's built-in functions for evaluating numerical integrals, together with its 3D plotting, to produce a diagram of the Cornu spiral as a function of integration limits. Script
set xlabel "$x$"
set ylabel "$y$"
set zlabel "$t$"
set xrange [-pi*0.4:pi*0.4]
set yrange [-pi*0.4:pi*0.4]
set zrange [-6:6]
set trange [-6:6]
set xformat r"%s$\pi$"%(x/pi)
set yformat r"%s$\pi$"%(y/pi)
set xtics 0.2*pi ; set mxtics 0.05*pi
set ytics 0.2*pi ; set mytics 0.05*pi
set samples 1000
set key above
set size square
set grid
plot 3d parametric (int_dq(sin(q**2),0,t)):(int_dq(cos(q**2),0,t)):t
|
