Pyxplot |
Examples - Surface with contours |
Pyxplot is
sponsored and
hosted by

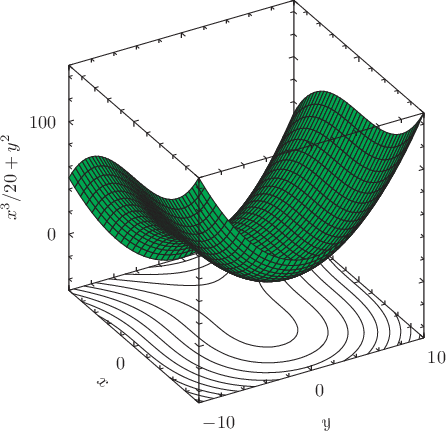
An example of a surface and contours on a 3D plot Pyxplot's surface plotting style evaluates a function at a grid of points in the x-y plane, and draws a 3D surface showing how the function varies across the plane. Here, we also use the contours plotting style, which on a 3D plot draws contours on a function on the back face of the plot, here on the bottom x-y plane of the plot cube. Script
set xlabel "$x$"
set ylabel "$y$"
set zlabel "$x^3/20+y^2$"
set nokey
set size 6 square
set nogrid
plot 3d x**3/20+y**2 with surface col black fillc green, \
        x**3/20+y**2 with contours col black
|