Pyxplot |
Examples - Branch cut |
Pyxplot is
sponsored and
hosted by

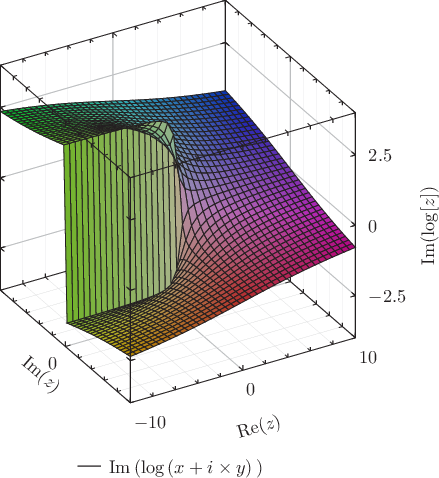
An example of the surface plotting style, and a branch cut Pyxplot's surface plotting style evaluates a function at a grid of points in the x-y plane, and draws a 3D surface showing how the function varies across the plane. For added prettiness, an expression is also given for the color of the line, which varies from point to point. As in expressions passed to the using modifier, the columns of data are referred to as $1 for the first column, i.e. x; $2 for the second column, y; etc. The expression given here uses the built-in function hsb() to produce a color object with the specified hue, saturation and brightness. The cliff-face on this plot is a branch cut. Script
set numerics complex
set xlabel r"Re($z$)"
set ylabel r"Im($z$)"
set zlabel r"$\mathrm{Im}(\mathrm{log}[z])$"
set key below
set size 6 square
set grid
set view -30,30
plot 3d [-10:10][-10:10] Im(log(x+i*y)) \
     with surface col black \
     fillcol hsb(atan2($1,$2)/(2*pi)+0.5,hypot($1,$2)/18+0.2,0.7)
|