Pyxplot |
Examples - Map Of Australia |
Pyxplot is
sponsored and
hosted by

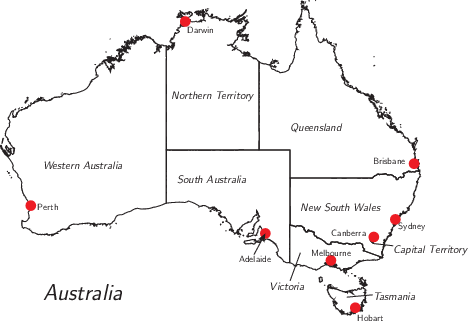
Using Pyxplot's 'set arrow' and 'set label' commands (I) In the example, we use Pyxplot's set arrow and set label commands to generate a labelled map of Australia. Script
# We want a plot without axes or key
set nokey
set fontsize 0.6
set size 10 ratio (45-10)/(154-112)*cos(25*unit(deg))
set xrange [112:154]
set yrange [-45:-10]
set axis x invisible
set axis y invisible

# Labels for the states
set label 1 r'{\large \sf \slshape Western Australia}' 117, -28
set label 2 r'{\large \sf \slshape South Australia}' 130, -29.5
set label 3 r'{\large \sf \slshape Northern Territory}' 129.5, -20.5
set label 4 r'{\large \sf \slshape Queensland}' 141,-24
set label 5 r'{\large \sf \slshape New South Wales}' 142,-32.5
set label 6 r'{\large \sf \slshape Victoria}' 139,-41
set arrow 6 from 141,-40 to 142, -37 with nohead
set label 7 r'{\large \sf \slshape Tasmania}' 149,-42
set arrow 7 from 149, -41.5 to 146.5, -41.75 with nohead
set label 8 r'{\large \sf \slshape Capital Territory}' 151,-37
set arrow 8 from 151, -36.25 to 149, -36 with nohead

# Labels for the cities
set label 10 r'{\sf Perth}' 116.5, -32.4
set label 11 r'{\sf Adelaide}' 136, -38
set arrow 11 from 137.5,-37.2 to 138.601, -34.929
set label 12 r'{\sf Darwin}' 131, -13.5
set label 13 r'{\sf Brisbane}' 149, -27.5
set label 14 r'{\sf Sydney}' 151.5, -34.5
set label 15 r'{\sf Melbourne}' 143, -37.3
set label 16 r'{\sf Hobart}' 147.5, -44.25
set label 17 r'{\sf Canberra}' 145, -35.25

# A big label saying "Australia"
set label 20 r'{\Huge \sf \slshape Australia}' 117,-42

# Plot the coastline and cities
plot 'map_1.dat.gz' every ::1 with lines, \
     'map_2.dat' with points pointtype 17 pointsize 1.4
|