Pyxplot |
Examples - Polygons |
Pyxplot is
sponsored and
hosted by

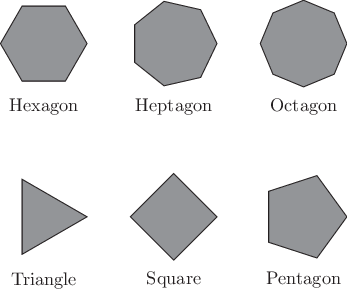
Using the polygon command This example uses the polygon command, a rotation matrix, and nested for loops to construct diagrams of the first eight regular polygons. Script
rotate(a) = matrix( [cos(a), -sin(a)], \
                    [sin(a),  cos(a)] )

subroutine makePolygon(Nsides, centre)
 {
  points = []
  for i=0 to Nsides
   {
    call points.append(centre + \
       rotate(i/Nsides*unit(rev)) * vector(1,0))
   }
  polygon points with fillcol gray50 col black
 }

set nodisplay ; set multiplot

set texthalign center
set textvalign top

foreach datum x,y,Nsides,name in "--"
 {
  call makePolygon(Nsides,vector(x,y))
  text name at x,y-1.25
 }
0 0 3 Triangle
3 0 4 Square
6 0 5 Pentagon
0 4 6 Hexagon
3 4 7 Heptagon
6 4 8 Octagon
END

set display ; refresh
|
