Pyxplot |
Examples - Lenses |
Pyxplot is
sponsored and
hosted by

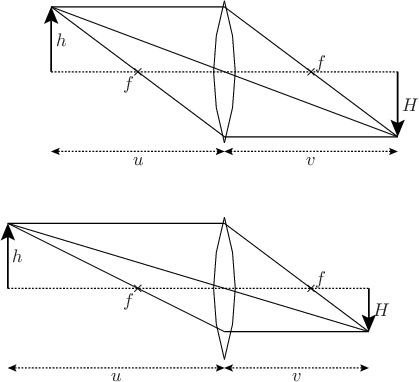
Using the arc command to draw an optics diagram In this example, we make a subroutine to draw labelled diagrams of converging lenses forming real images. Script
# Define subroutine for drawing lens diagrams
subroutine lensDraw(x0,y0,u,h,f)
 {
  # Use the thin-lens equation to find v and H
  v = 1/(1/f - 1/u)
  H = h * v / u

  # Draw lens
  lc = 5.5*unit(cm) # Radius of curvature of lens
  lt = 0.5*unit(cm) # Thickness of lens
  la = acos((lc-lt/2)/lc) # Angular size of lens from center of curvature
  lh = lc*sin(la) # Physical height of lens on paper
  arc at x0-(lc-lt/2),y0 radius lc from  90*unit(deg)-la to  90*unit(deg)+la
  arc at x0+(lc-lt/2),y0 radius lc from 270*unit(deg)-la to 270*unit(deg)+la
  set texthalign right ; set textvalign top
  point at x0-f,y0 label "$f$"
  set texthalign left  ; set textvalign bottom
  point at x0+f,y0 label "$f$"

  # Draw object and image
  arrow from x0-u,y0 to x0-u,y0+h with lw 2
  arrow from x0+v,y0 to x0+v,y0-H with lw 2
  text "$h$" at x0-u,y0+h/2 hal l val c gap unit(mm)
  text "$H$" at x0+v,y0-H/2 hal l val c gap unit(mm)

  # Draw construction lines
  line from x0-u,y0 to x0+v,y0 with lt 2 # Optic axis
  line from x0-u,y0+h to x0+v,y0-H # Undeflected ray through origin
  line from x0-u,y0+h to x0,y0+h
  line from x0,y0+h to x0+v,y0-H
  line from x0+v,y0-H to x0,y0-H
  line from x0,y0-H to x0-u,y0+h

  # Label distances u and v
  ylabel = y0-lh-2*unit(mm)
  arrow from x0-u,ylabel to x0,ylabel with twoway lt 2
  arrow from x0+v,ylabel to x0,ylabel with twoway lt 2
  text "$u$" at x0-u/2,ylabel hal c val t gap unit(mm)
  text "$v$" at x0+v/2,ylabel hal c val t gap unit(mm)
 }

# Display diagram of lens
set unit angle nodimensionless
set multiplot ; set nodisplay
call lensDraw(0*unit(cm),0*unit(cm), 5*unit(cm),1.5*unit(cm),2*unit(cm))
call lensDraw(0*unit(cm),5*unit(cm), 4*unit(cm),1.5*unit(cm),2*unit(cm))
set display ; refresh
|