Pyxplot |
Examples - Labelled ellipse |
Pyxplot is
sponsored and
hosted by

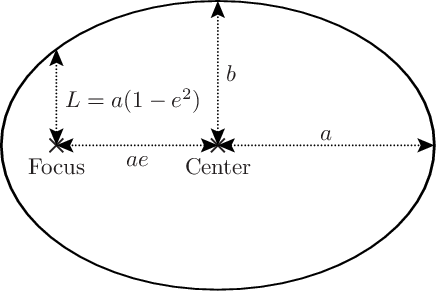
Using the ellipse command to draw a labelled ellipse Here, an ellipse of moderate eccentricity e is drawn using Pyxplot's ellipse command, and then its important features are labelled. The semi-major axis a and semi-minor axis b are both marked, as well as the semi-latus rectum L. Script
set multiplot ; set nodisplay

a   = 5.0              # Semi-major axis
b   = a*2/3            # Semi-minor axis
e   = sqrt(1-(b/a)**2) # Eccentricity
slr = a*(1-e**2)       # Length of semi-latus rectum
fd  = a*e              # Distance of focus from center

# Draw ellipse
ellipse center 0,0 semiMajor a semiMinor b with lw 3

# Draw points at center and focus
set texthalign center ; set textvalign top
set fontsize 1.5
point at 0,0 label "Center" with pointsize 2 plw 2
point at -fd,0 label "Focus" with pointsize 2 plw 2

# Draw arrows and dotted lines on ellipse
arrow from 0,0 to 0,b with twohead lw 2 lt 3   # Semi-minor axis
arrow from 0,0 to a,0 with twohead lw 2 lt 3   # Semi-major axis
arrow from -fd,0 to -fd,slr with tw lw 2 lt 3  # SLR
arrow from 0,0 to -fd,0 with twohead lw 2 lt 3 # Focus <-> Center

# Label ellipse
set texthalign center ; set textvalign center
text r'$ae$' at -fd/2,-0.3
text r'$a$' at a/2,+0.3
text r'$b$' at 0.3,b/2
set texthalign left ; set textvalign center
text r'$L=a(1-e^2)$' at  0.2-fd,slr/2

# Display diagram
set display ; refresh
|