Pyxplot |
Examples - Pythagoras theorem |
Pyxplot is
sponsored and
hosted by

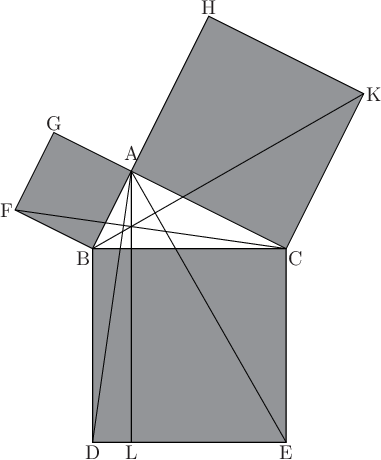
Using lines, boxes and text labels for geometric construction In this example, Pyxplot's arrow and text commands are used to produce a diagram illustrating Euclid's proof of Pythagoras' theorem. Script
set unit angle nodimensionless
set multiplot ; set nodisplay

# Lengths of three sides of triangle
AB = 2*unit(cm)
AC = 4*unit(cm)
BC = hypot(AC, AB) # Hypotenuse
CBA = atan2(AC, AB) # Angle CBA

# Positions of three corners of triangle
Bx = 0*unit(cm)       ; By = 0*unit(cm) # The origin
Cx = Bx + BC          ; Cy = By
Ax = Bx + AB*cos(CBA) ; Ay = By + AB*sin(CBA)

# Positions of constructed points
Dx = Bx               ; Dy = -BC
Lx = Ax               ; Ly = Dy
Ex = Cx               ; Ey = Dy

Hx = Bx + (AB + AC) * cos(CBA)
Hy = By + (AB + AC) * sin(CBA)
Kx = Cx + (     AC) * cos(CBA)
Ky = Cy + (     AC) * sin(CBA)

Fx = Bx + AB*cos(CBA+90*unit(deg))
Fy = By + AB*sin(CBA+90*unit(deg))
Gx = Ax + AB*cos(CBA+90*unit(deg))
Gy = Ay + AB*sin(CBA+90*unit(deg))

# Construct diagram
box from Dx,Dy to Cx,Cy with fillcol gray50
box at Ax,Ay width AC height AC rot CBA-90*unit(deg) with fillcol gray50
box at Bx,By width AB height AB rot CBA with fillcol gray50
line from Bx,By to Kx,Ky
line from Fx,Fy to Cx,Cy
line from Ax,Ay to Dx,Dy
line from Ax,Ay to Lx,Ly
line from Ax,Ay to Ex,Ey

# Label diagram
set fontsize 1.3
TG = 0.5*unit(mm) # Gap left between labels and figure
text "A" at Ax,Ay gap TG*5 hal c val b
text "B" at Bx,By gap TG   hal r val t
text "C" at Cx,Cy gap TG   hal l val t
text "D" at Dx,Dy gap TG   hal c val t
text "E" at Ex,Ey gap TG   hal c val t
text "F" at Fx,Fy gap TG   hal r val c
text "G" at Gx,Gy gap TG   hal c val b
text "H" at Hx,Hy gap TG   hal c val b
text "K" at Kx,Ky gap TG   hal l val c
text "L" at Lx,Ly gap TG   hal c val t

# Display diagram
set display ; refresh
|