5.6 Function fitting
The fit command can be used to fit arbitrary functional forms to data points read from files. It can be used to produce best-fit lines1 for datasets, or to determine gradients and other mathematical properties of data by looking at the parameters associated with the best-fitting functional form.
The following simple example fits a straight line to data in a file called data.dat:
f(x) = a*x+b
fit f() 'data.dat' index 1 using 2:3 via a,b
The first line specifies the functional form which is to be used. The coefficients of this function, a and b, which are to be varied during the fitting process, are listed after the keyword via in the fit command. The modifiers index, every, select and using have the same meanings as in the plot command.
When a function of  variables is being fit, at least
  columns (or rows – see Section 3.9.1) of data must be specified after the using modifier. By default, the first columns are used. These correspond to the values of each of the arguments to the function, plus finally the value which the output from the function is aiming to match.
If an additional column is specified, then this is taken to contain the standard error in the value that the output from the function is aiming to match, and can be used to weight the data points which are being used to constrain the fit.
As an example, below we generate a data file containing samples of a square wave using the tabulate command and fit the first three terms of a truncated Fourier series to it:
set samples 10
set output 'square.dat'
tabulate [-pi:pi] 1-2*heaviside(x)

f(x) = a1*sin(x) + a3*sin(3*x) + a5*sin(5*x)
fit f() 'square.dat' via a1, a3, a5
set xlabel '$x$' ; set ylabel '$y$'
plot 'square.dat' title 'data' with points pointsize 2, \
     f(x) title 'Fitted function' with lines
![\includegraphics[width=8cm]{examples/eps/ex_fitting}](images/img-0163.png)
As the fit command works, it displays statistics including the best fit values of each of the fitting parameters, the uncertainties in each of them, and the covariance matrix. These can be useful for analysing the security of the fit achieved, but calculating the uncertainties in the best fit parameters and the covariance matrix can be time consuming, especially when many parameters are being fitted simultaneously. The optional word withouterrors can be included immediately before the filename of the input data file to substantially speed up cases where this information is not required.
By default, the starting values for each of the fitting parameters is  . However, if the variables to be used in the fitting process are already set before the fit command is called, these initial values are used instead. For example, the following would use the initial values
 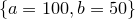 :
:
f(x) = a*x+b
a = 100
b = 50
fit f() 'data.dat' index 1 using 2:3 via a,b
If any of the fitting coefficients are not dimensionless – that is, they have physical units such as meters or seconds – then an initial value with the appropriate units must be specified.
A few points are worth noting:
A series of ranges may be specified after the fit command, using the same syntax as in the plot command, as described in Section 3.14. If ranges are specified then only data points falling within these ranges are used in the fitting process; the ranges refer to each of the
variables of the fitted function in order: fit [0:10] f() 'data.dat' via a
As with all numerical fitting procedures, the fit command comes with caveats. It uses a generic fitting algorithm, and may not work well with poorly behaved or ill-constrained problems. It works best when all of the values it is attempting to fit are of order unity. For example, in a problem where
 was of order
  , the following might fail:
 f(x) = a*x fit f() 'data.dat' via a
However, better results might be achieved if
were artificially made of order unity, as in the following script: f(x) = 1e10*a*x fit f() 'data.dat' via a
For those interested in the mathematical details, the workings of the fit command are discussed in more detail in Appendix C.
Footnotes
- Another way of producing best-fit lines is to use the interpolate command; more details are given in Section 5.7