Pyxplot |
Examples - Cubed function |
Pyxplot is
sponsored and
hosted by

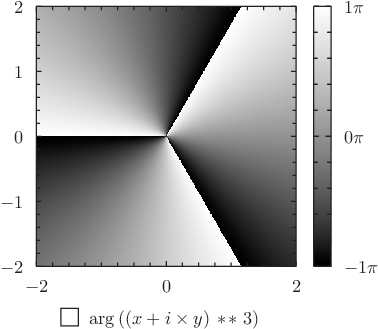
Example plot - a color map with branch cuts Pyxplot's colormap plot style produces a color representation of how a function varies across the x-y plane, where different colors represent different values of the function. Here a grayscale color map is produced of the argument of the cube of (x+iy), with three branch cuts clearly visible. Script
set numerics complex
set sample grid 400x400
set nogrid
set size square
set key below

set c1range[-pi:pi]
set c1format r"$%s\pi$"%(c/pi)

plot [-2:2][-2:2] arg((x+i*y)**3) with colormap
|
