Pyxplot |
Examples - Labelled triangles |
Pyxplot is
sponsored and
hosted by

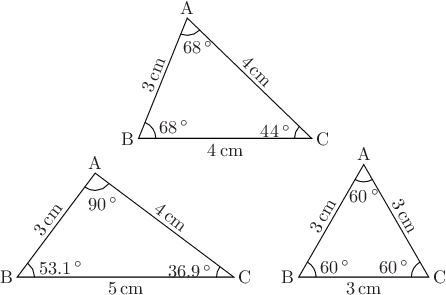
Using the polygon command and Pyxplot's maths environment to construct triangles In this example, we make a subroutine to draw labelled diagrams of the interior angles of triangles, taking as its inputs the lengths of the three sides of the triangle to be drawn and the position of its lower-left corner. The subroutine calculates the positions of the three vertices of the triangle and then labels them. We use Pyxplot's automatic handling of physical units to generate the LaTeX strings required to label the side lengths in centimetres and the angles in degrees. We use Pyxplot's arc command to draw angle symbols in the three corners of a triangle. Script
set unit angle nodimensionless
set unit of length cm # Display lengths in cm
set unit of angle degree # Display angles in degrees
set numeric sigfig 3 display latex # Correct to 3 significant figure
cm  = unit(cm) # Shorthand to save space
deg = unit(deg)

turn(a) = matrix( [cos(a),-sin(a)], \
                  [sin(a), cos(a)]  )

# Define subroutine for drawing triangles
subroutine triangleDraw(B,AB,AC,BC)
 {
  # Use cosine rule to find interior angles
  ABC = acos((AB**2 + BC**2 - AC**2) / (2*AB*BC))
  BCA = acos((BC**2 + AC**2 - AB**2) / (2*BC*AC))
  CAB = acos((AC**2 + AB**2 - BC**2) / (2*AC*AB))

  # Positions of three corners of triangle
  C = B + vector(BC,0*cm)
  A = B + turn(ABC)*vector(AB,0*cm)

  # Draw triangle
  polygon [A,B,C]

  # Draw angle symbols
  arcRad = 0.4*cm # Radius of angle arcs
  arc at B radius arcRad from  90*deg-ABC to  90*deg
  arc at C radius arcRad from -90*deg     to -90*deg+BCA
  arc at A radius arcRad from  90*deg+BCA to 270*deg-ABC

  # Label lengths of sides
  textGap = 0.1*cm
  text "%s"%(BC) at (B+C)/2 gap textGap hal c val t
  text "%s"%(AB) at (A+B)/2 gap textGap rot  ABC hal c val b
  text "%s"%(AC) at (A+C)/2 gap textGap rot -BCA hal c val b

  # Label angles
  arcRad2 = vector(1.4*arcRad , 0*cm)
  text "%s"%CAB at A+turn(-90*deg+ABC-BCA)*arcRad2 hal c val t
  text "%s"%ABC at B+turn(          ABC/2)*arcRad2 hal l val c
  text "%s"%BCA at C+turn(180*deg - BCA/2)*arcRad2 hal r val c

  # Label points ABC
  text "A" at A gap textGap hal c val b
  text "B" at B gap textGap hal r val c
  text "C" at C gap textGap hal l val c
 }

# Display diagram with three triangles
set multiplot ; set nodisplay
call triangleDraw(vector([2.8,3.2])*cm, 3*cm, 4*cm, 4*cm)
call triangleDraw(vector([0.0,0.0])*cm, 3*cm, 4*cm, 5*cm)
call triangleDraw(vector([6.5,0.0])*cm, 3*cm, 3*cm, 3*cm)
set display ; refresh
|
