Pyxplot |
Examples - Newton fractal |
Pyxplot is
sponsored and
hosted by

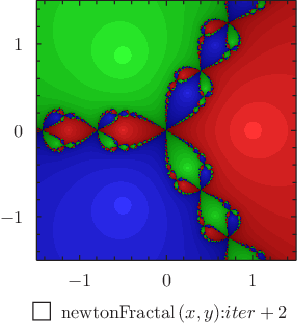
Example plot - using the colormap plot style to draw the Newton fractal The Newton fractal for the polynomial z**3-1, plotted using the colormap plot style. In addition to coloring points red, green or blue depending upon which root of the polynomial the Newton-Raphson iteration converges to, we also assign points different brightnesses depending upon how long the iteration takes to converge. Script
set numerics complex
set unit angle nodimensionless

root1 = exp(i*unit(  0*deg))
root2 = exp(i*unit(120*deg))
root3 = exp(i*unit(240*deg))

tolerance = 1e-2

subroutine newtonFractal(x,y)
 {
  global iter
  z = x+i*y
  iter = 0
  while (1)
   {
    z = z - (z**3-1)/(3*z**2)
    if abs(z-root1)
|