Pyxplot |
Examples - A clock |
Pyxplot is
sponsored and
hosted by

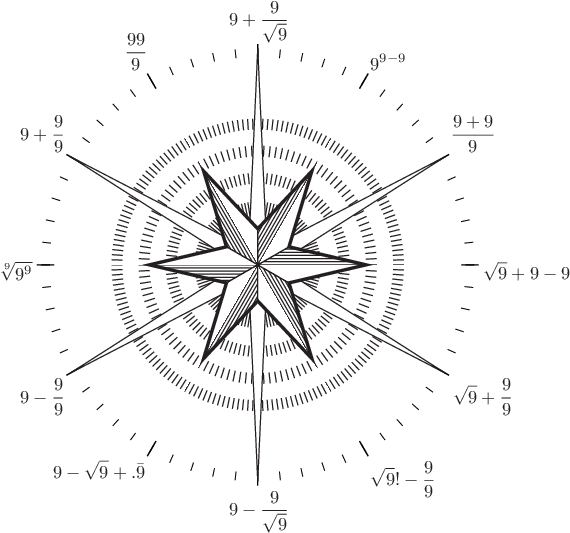
Example plot - a novelty clock In this example script, we use Pyxplot's text command and stars plotting style to produce a novelty clock where all of the numerals are made up from three nines. Script
# Make an eps image of a star to go in the centre of the image

set term eps
set out 'star.eps'
set axis x invisible
set axis y invisible
set nokey
plot '--' with stars
0 0
END
clear

# Now make the clock proper

set output 'output.eps'

set fontsize 1.2

w          = 10
w2         = w/2
eps_margin = 0.2
rad        = w2+eps_margin

rot(theta) = vector(sin(theta),cos(theta))
p(theta) = rad * rot(theta)

set multiplot ; set nodisplay

# Make the numbers from 1 to 12

set texthalign centre
text r"\parbox{2in}{\[9+\frac{9}{\sqrt{9}}\]}" at p(0)

set texthalign left
text r"\parbox{2in}{\[9^{9-9}\]}" at p(pi/6)
text r"\parbox{2in}{\[\frac{9+9}{9}\]}" at p(pi/3)

set textvalign centre
text r"\parbox{2in}{\[\sqrt{9}+9-9\]}" at p(pi/2)

set textvalign top
text r"\parbox{2in}{\[\sqrt{9}+\frac{9}{9}\]}" at p(2*pi/3)
text r"\parbox{2in}{\[\sqrt{9}!-\frac{9}{9}\]}" at p(5*pi/6)

set texthalign centre
text r"\parbox{2in}{\[9-\frac{9}{\sqrt{9}}\]}" at p(pi)

set texthalign right
text r"\parbox{2in}{\[9-\sqrt{9}+.\bar{9}\]}" at p(7*pi/6)
text r"\parbox{2in}{\[9-\frac{9}{9}\]}" at p(4*pi/3)

set textvalign centre
text r"\parbox{2in}{\[\sqrt[9]{9^{9}}\]}" at p(3*pi/2)

set textvalign bottom
text r"\parbox{2in}{\[9+\frac{9}{9}\]}" at p(10*pi/6)
text r"\parbox{2in}{\[\frac{99}{9}\]}" at p(11*pi/6)

for i = 0 to 2*pi step pi/30
 {
  arrow from w/2*rot(i) to (w2-eps_margin)*rot(i) w nohead
 }

for i = 0 to 2*pi step pi/6
 {
  arrow from (w2+    eps_margin/2)*rot(i) \
        to   (w2-1.5*eps_margin  )*rot(i) w nohead lw 1.5
 }

set texthalign centre
set textvalign centre
eps 'star.eps' at 0,0 wid w/2 rot -10

set display ; refresh
|
